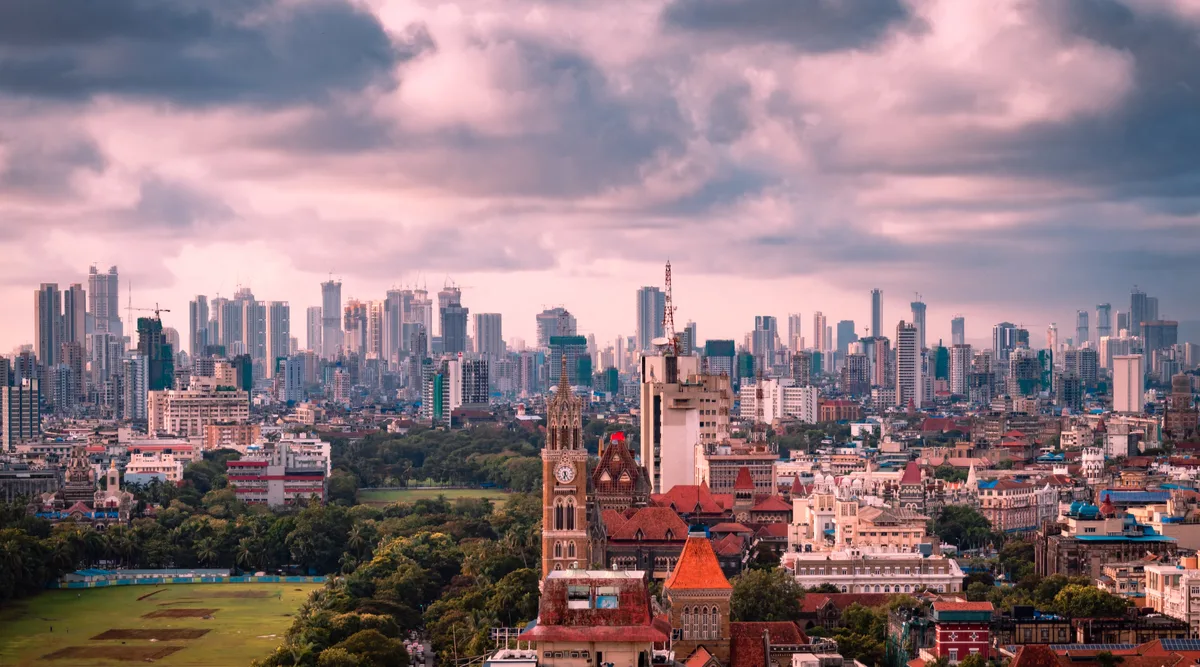
India does not run on a uniform economic engine. Instead, output gathers within a compact set of coastal and industrial states, pulling capital and labor across borders into a few crowded corridors. The top five states account for approximately 50% of India’s total GDP, while the bottom five contribute only about 10%1. Income levels mirror this split. Among the major states, Goa and Gujarat had per capita incomes respectively about 10 times and 6 times that of Bihar, indicating vast inter-state disparities in income levels1. Strong market forces indicate the asymmetry will stay and lead to migration to developed states2.
Five states make half the economy
Economic production in India has settled into an uneven geographic pattern that defies political borders. The top five states, Maharashtra, Tamil Nadu, Uttar Pradesh, Karnataka, and Gujarat, collectively contribute more than 49% of India’s total economy3. In FY 2024–25, Maharashtra accounted for 13.98% of India’s GSDP at current prices, followed by Tamil Nadu at 9.43% and Uttar Pradesh at 9.15%3. That three states generate almost a third of national output reveals how tightly enterprise clings to established industrial bases. In FY 2023–24, Maharashtra had the highest GSDP at current prices of ₹4,055,847 crore among Indian states, while Mizoram had the lowest at ₹33,277 crore4.
This scale difference of more than a hundred to one between the largest and smallest state economies filters directly into household earnings. In FY 2023–24, Sikkim recorded the highest per capita income at current prices (₹587,743) and Bihar the lowest (₹62,201) among Indian states/UTs4. When measured in real terms to strip out regional price distortions, the gap remains just as wide. In 2023, real per capita income ranged from ₹32,174 in Bihar to ₹295,114 in Goa, reflecting a nearly ninefold disparity among Indian states5.
Economic geography explains part of this divergence. Coastal states gained early advantages in shipping links, port infrastructure, and proximity to international trade routes. Over decades, those initial physical gains translated into denser supplier networks, specialized labor pools, and established merchant ecosystems. Inland states, particularly in the northern and eastern plains, remained tied to agriculture and public sector expenditure. Their demographic weight has expanded without a matching transition toward high-productivity manufacturing or tradable services.
Regional polarization creates a self-reinforcing cycle. When output concentrates in five states, state governments in those jurisdictions collect larger tax revenues from consumption, real estate transactions, and formal corporate activity. Those revenues allow higher spending on roads, power networks, and urban transport systems, which pulls in private capital. States with depressed output face persistent budget deficits, constraining their ability to finance basic logistics or industrial land acquisition. The resulting gap separates a modern formal economy from jurisdictions struggling to sustain subsistence livelihoods.
Bank credit follows old money
Financial capital shows even sharper spatial concentration than headline state output. Maharashtra, Gujarat, and Karnataka jointly host over 41% of the total number of investment projects in India1. Capitalists select these locations because existing supply chains reduce the operational uncertainty of greenfield facilities. A factory setting up in Pune, Sanand, or Sriperumbudur finds immediate access to component vendors, skilled machinists, testing laboratories, and freight aggregators. Attempting the same build in an industrially sparse district imposes friction costs that private balance sheets refuse to bear.
Commercial lenders follow these corporate decisions. The same three states, Maharashtra, Gujarat, Karnataka, together account for more than 62% of total bank credit and 52% of bank deposits in India1. Commercial banking operates on liquidity redeployment, taking deposits from areas with low credit absorption capacity and lending them to regions with high borrowing appetite. In practice, household savings generated across agrarian towns throughout northern, central, and eastern India are intermediated by commercial banks into industrial credit deployed within Mumbai, Ahmedabad, and Bengaluru.
The financial desertification of peripheral states shows up starkly at the lower boundary of the credit distribution. In the bottom ten states, each accounts for less than 1% of total bank credit, and seven of them account for less than 1% of bank deposits1. When an entire state commands less than one percent of national credit, local commercial enterprises cannot secure working capital to scale up operations. Small manufacturers must rely on personal savings or informal credit lines that charge steep risk premiums.
This structural imbalance in lending reinforces productivity gaps. Advanced manufacturing, high-value enterprise software, and organized logistics require significant capital intensity. Because banks deploy sixty-two percent of their lending to just three western and southern states, capital-deepening occurs in those specific urban belts. Under-credited states remain trapped in low-productivity, cash-based commerce. The banking system effectively acts as a pipeline that extracts domestic savings from the interior to underwrite asset formation along the coast.
The top five states account for approximately 50% of India’s total GDP, while the bottom five contribute only about 10%.
A few pin codes drive entire state outputs
State-level aggregates disguise an even more acute reality: economic output is hyper-concentrated within isolated urban pockets. Within Karnataka, Bengaluru Urban district alone contributes 40% of the state’s GSDP1. The rest of Karnataka, comprising twenty-nine other districts, divides the remaining sixty percent. The tech services boom, corporate headquarters, and venture-funded startup ecosystem sit inside a small urban perimeter, leaving northern districts like Kalaburagi, Raichur, and Yadgir economically detached from the prosperity of the capital.
A parallel pattern defines the Deccan plateau. In Telangana, Rangareddy and Hyderabad Metropolitan districts together account for 35% of the state’s GSDP1. State revenues flow overwhelmingly from commercial office developments, software campuses, and pharmaceutical laboratories clustered in this single urban core. Outside this belt, the rural hinterland relies heavily on agricultural welfare transfers financed by taxes extracted from the capital city's real estate and corporate payrolls.
Western India reflects identical geographic clustering. Mumbai and Thane districts together generate 35% of Maharashtra’s GSDP1. Even within a state whose annual output stands at ₹4,055,847 crore, two contiguous coastal districts generate more than a third of all economic value. Vidarbha and Marathwada face chronic under-investment, agricultural distress, and limited factory development, while capital gathers along the Mumbai-Thane urban spine.
Northern states follow the same script. In Uttar Pradesh, the districts Gautam Buddha Nagar, Lucknow, and Ghaziabad together contribute nearly 25% of the state’s GSDP1. Two of those districts sit directly inside the National Capital Region, acting as industrial extensions of New Delhi rather than organic offshoots of the Uttar Pradesh interior. The state's eastern districts show limited industrial footprints. Similarly, Jaipur district alone contributes 15% of Rajasthan’s GSDP1, serving as the state's dominant node for commerce, public administration, and hospitality.
These concentrated districts function as islands of high productivity surrounded by agrarian hinterlands. Agglomeration economies draw corporate headquarters, financial service providers, and technology firms together because close physical proximity lowers communication costs and broadens professional recruiting options. For the states containing them, these city-districts provide the tax base required to keep public budgets solvent. Yet that reliance leaves entire state balance sheets exposed to municipal bottlenecks, land constraints, and infrastructure deterioration in a few crowded postcodes.
Export engines run on single-district factories
Merchandise trade reveals India's geographical concentration at its most extreme. In exports, the top three states, Gujarat, Maharashtra, and Tamil Nadu, account for 55% of India’s total exports1. This dominance stems from deep-water ports, dedicated export processing zones, and private industrial ecosystems developed over four decades. The rest of the nation barely registers on international trading boards. The bottom ten states each account for less than 0.5% of India’s total exports1.
This export performance is built on specific district monopolies rather than broad statewide competence. Gujarat accounts for 77% of India’s total petroleum exports, and within that, Jamnagar district alone accounts for 67%1. The presence of massive private refining infrastructure transforms a single coastal district on the Gulf of Kutch into the focal point of India's energy trade. Without Jamnagar, national export statistics would register a dramatic drop in value.
Electronics manufacturing exhibits an identical structural pattern. Tamil Nadu contributes 42% of India’s total electronics exports, with Kanchipuram district alone responsible for 35%1. Contract manufacturers producing smartphones, electronic circuit boards, and telecommunications components have gathered in this single corridor near Chennai. The availability of air cargo logistics, port access, and industrial land allocations has anchored multinational supply chains in one district, while other states struggle to attract hardware assembly lines.
Gems and jewellery follow the same geographic discipline. Maharashtra contributes 46% of India’s total gems and jewellery exports, while Mumbai Suburban district alone accounts for 38%1. Decades of specialized merchant networks, trade diamond bourses, and skilled artisanal workshops keep precious stone processing anchored to Mumbai. Replicating these tightly woven supply chains elsewhere is difficult because trust, speed, and specialized security systems cannot be created overnight through administrative decrees.
Single-district industrial clusters create high geographic vulnerability. When two-thirds of petroleum exports depend on Jamnagar, or over a third of electronics exports rely on Kanchipuram, localized supply shocks, regulatory disputes, or municipal infrastructure failures pose risks to national foreign exchange receipts. India's export identity is not a diversified national fabric; it is a federation of specialised industrial islands.
Moving people to where capital works
Market mechanisms rarely spread capital evenly across wide territories. Instead, modern economies concentrate investment in locations where productivity is already high, transport friction is low, and supplier networks are deep. Because capital insists on locating in Maharashtra, Gujarat, and Tamil Nadu, workers from lower-income states must pack their bags and follow it. Strong market forces indicate the asymmetry will stay and lead to migration to developed states2.
Internal migration serves as the primary equilibrating mechanism for inter-state earnings disparities. When real per capita income in Bihar stands at ₹32,174 compared to ₹295,114 in Goa, or per capita income at current prices shows a tenfold gap, moving to an industrial center is the only path to economic advancement for rural households1,4,5. Millions of workers travel every season from Bihar, eastern Uttar Pradesh, Odisha, and Jharkhand to construction sites, factory floors, and delivery fleets in Surat, Bengaluru, Pune, and Chennai.
This demographic flow places immense physical pressure on receiving cities. Water networks, suburban commuter railways, public healthcare clinics, and low-cost housing stocks in major metropolitan districts face persistent strain. Urban local bodies must be equipped to absorb their flows2. Most municipal corporations in India lack independent fiscal powers, relying on state-level grants and ad-hoc allocations. They cannot raise sufficient debt or levy property taxes at market-clearing levels to expand water mains, sewage treatment, or transit lines.
Institutional constraints prevent direct federal intervention in municipal finance. While the Finance Commissions can’t fund local bodies directly, they can incentivize states to work on granting local bodies administrative capacity and fiscal autonomy2. Under constitutional divisions of power, urban administration remains a state subject. The central government cannot bypass state secretariats to deposit infrastructure capital directly into city bank accounts. It must work through conditional grants that tie state fiscal devolution to urban governance reforms.
Those reforms must focus on municipal revenue independence, transparent land valuation, and administrative staffing. If receiving cities are starved of operational funds, migrant labor ends up living in informal settlements without piped sanitation or formal tenancy protection. This lowers their productivity, suppresses urban living standards, and triggers political friction over public resources. India cannot force industrial capital into every district, but it can ensure that cities absorbing national migration have the fiscal capacity to build housing, roads, and utilities for the workforce keeping the economy moving.
By the numbers
- ₹4,055,847 crore4
- Maharashtra's GSDP in FY 2023–24
- ₹33,277 crore4
- Mizoram's GSDP in FY 2023–24
- ₹587,7434
- Sikkim's highest per capita income at current prices
- ₹62,2014
- Bihar's lowest per capita income at current prices
- 40%1
- Bengaluru Urban's contribution to Karnataka's GSDP
- 35%1
- Mumbai and Thane's contribution to Maharashtra's GSDP
- 49%3
- Contribution of top five states to India's total economy
- 55%1
- Contribution of top three states to India's total exports
The lens: Porter's Diamond Model
How to break it down
- 1Factor Conditions: Analyze how natural resources, labor, and infrastructure vary across states and impact economic activity.
- 2Demand Conditions: Examine local market size and sophistication, influencing state economic growth.
- 3Related and Supporting Industries: Evaluate the presence of supplier and related industries that boost state competitiveness.
- 4Firm Strategy, Structure, and Rivalry: Assess how local policies and business environments shape state-level economic strategies.
What to watch
- Changes in state-level investment policies to attract industries to underdeveloped regions.
- Urban local bodies' initiatives to manage migration and provide services effectively.
- Finance Commissions' recommendations on incentivizing balanced regional growth.
For MBA aspirants
GD, PI and WAT
GD topic · Browse all GD topics
The impact of regional economic disparities on India's growth
For
- Regional disparities lead to uneven development and strain on urban infrastructure.
- Migration towards economically prosperous states can exacerbate urban congestion.
- Concentrated economic activity in few states limits national growth potential.
Against
- Economic specialization in certain states drives overall national growth.
- Migration can lead to better resource utilization and skill development.
- Concentrated economic activity fosters innovation and efficiency.
Questions an interviewer could ask · Browse all PI questions
- 1.How do regional disparities affect national economic policy?
- 2.What role can urban local bodies play in managing economic migration?
- 3.How can less developed states attract more investment projects?
- WAT prompt · Browse all WAT prompts
- Discuss the implications of economic disparities among Indian states.
- As a case
- Analyze how a company might decide which Indian state to invest in, considering economic disparities and regional policies.
Read it, then practise it
Could you crack this in an interview?
Reading builds the context; a timed attempt with a live AI interviewer builds the skill. MECE scores your structure, maths and synthesis and shows exactly where you lost marks.
Questions people ask
- What is the economic disparity among Indian states?
- The economic disparity among Indian states is significant, with the top five states contributing approximately 50% of India’s total GDP, while the bottom five contribute only about 10%1.
- Which states have the highest per capita income in India?
- Sikkim recorded the highest per capita income at ₹587,743, while Bihar had the lowest at ₹62,201 in FY 2023–244.
Notes and sources
- 1The unequal geography of India's economic activity—and how to address it | Mint · livemint.com
- 2Livemint · livemint.com
- 3GDP of Indian states - StatisticsTimes.com · statisticstimes.com
- 4GDP AND PCI OF ALL STATES/UTS AND ALL-INDIA · cdnbbsr.s3waas.gov.in
- 5CHAPTER 5 Indian States: Growing Faster Together · thedocs.worldbank.org
Figures are as published by these sources on or before 1 November 2026. Researched and drafted with AI, checked against the sources above and reviewed by the MECE team before publishing. Photographs are used under their open licences; the photographer and licence are credited under each one.
MECE Editorial
MECE Insights explains one business story a day for MBA students and aspirants: the facts with their sources, the strategy underneath, and how it can come up in a GD, a WAT or an interview.
Filed underEconomyIndia economic disparityGDP distribution IndiaState economic growth India